


















Skip to content
Autograph Analytics

Know your next move.

Decision Intelligence
for Automotive Retail

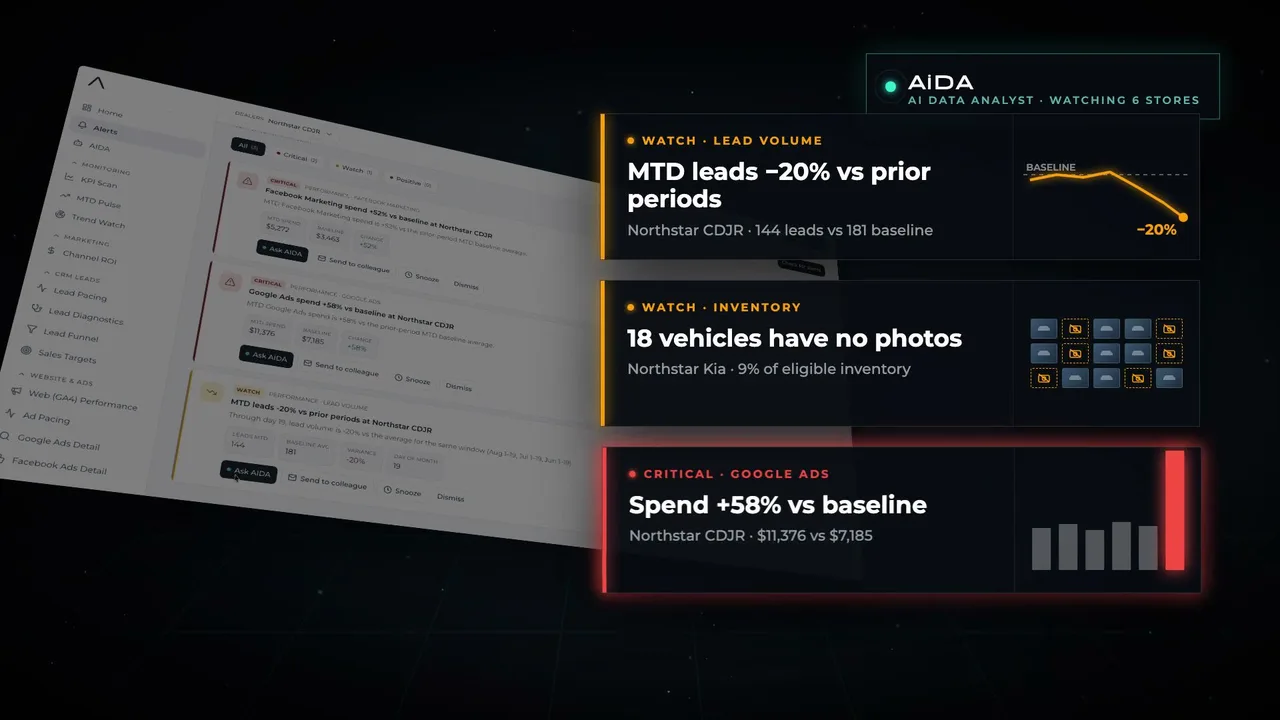
AiDA finds what’s driving performance — in seconds.

You already have the data. Finding the answer is the hard part.

Your CRM, DMS, advertising, website and inventory systems are constantly generating it.

AiDA does the investigative work for you.

Lead volume held steady — the drop is after the lead.

Trusted By Leading Dealer Groups

Dilwari Automotive Group
AutoCanada
Bannister
Weins Auto Group logo, a prominent Canadian automotive dealership group.
Wood Automotive Group
Steve Marshall Group logo, representing a respected automotive group.
Harris Auto Group logo, a notable Canadian automotive dealership network.
Pilicaro
Bourgeois
Tasca logo, representing a prominent automotive dealership group.
Westwind Honda logo, symbolizing a trusted Honda dealership focused on customer satisfaction.
Erinwood
Albrecht Auto Group logo, representing a trusted automotive dealership network.
Southern Maryland Auto logo, representing a well-established regional automotive group.

FIG 0.1

Seconds, not hours

To get from question to answer with AiDA.

FIG 0.2

Around the clock

Analysis of connected dealership data, every hour of every day.

FIG 0.3

One united view

Across marketing, CRM, sales, inventory and more.

The manual investigation problem

Stop jumping between platforms to find answers.

Bring dealership data together automatically — no pulling reports, no rebuilding spreadsheets.

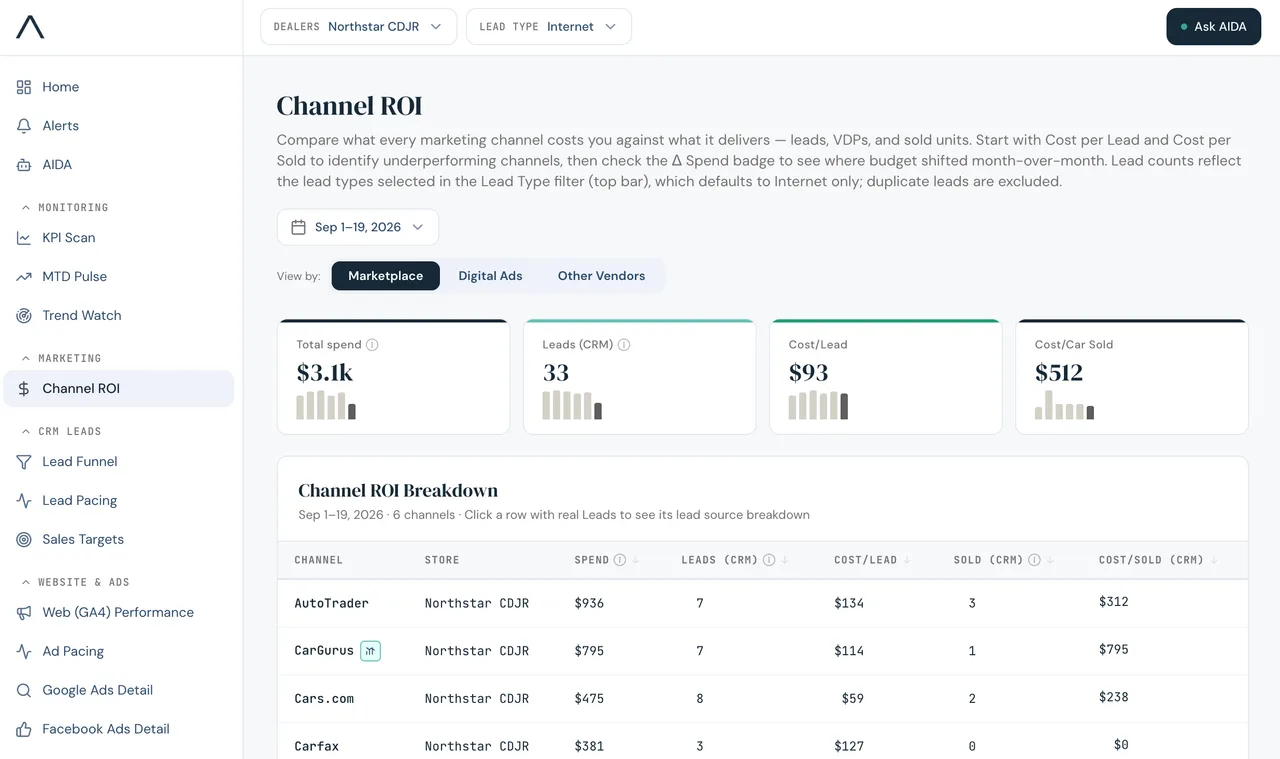
Connected once, reconciled continuously
Autograph dashboard: Channel ROI by marketing channel

Diagnosis

Find the real reason performance changed.

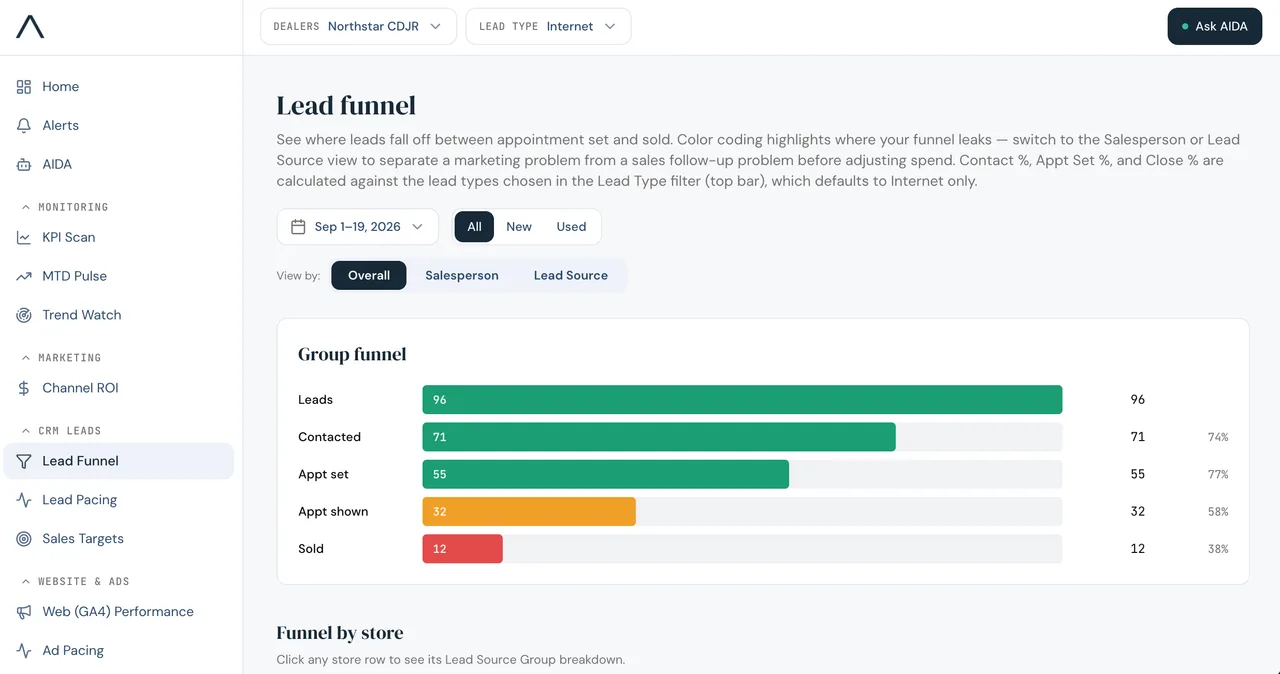
See where the breakdown is actually happening across marketing, leads, appointments, inventory and sales. Leadership believed lead volume was falling. It wasn’t.

The conversation changed from “how do we generate more leads?” to “why aren’t the leads we have progressing?”

The drop starts at appointment-set.
Autograph dashboard: lead funnel from lead to sold

The difference

Answers, not another
dashboard to manage.

AiDA continuously analyzes your connected dealership data to surface problems, opportunities and where to focus next.

  1. Traditional reporting

    A dashboard shows that a number moved. Someone still has to work out why.

    Step 01

  2. Signal detected

    AiDA spots the change that matters and separates it from week-to-week noise.

    Step 02

  3. Cause isolated

    It traces the change back through marketing, leads, sales and inventory.

    Step 03

  4. With AiDA

    You start with the answer and where to focus, not another report to read.

    Step 04

The answer is already in your data.

Your CRM, DMS, website, analytics, advertising and inventory systems already hold the pieces. AiDA connects the signals and does the investigative work to help you understand what they mean.

Decision intelligence, made concrete

Ask better questions. Get the answer faster.

Open a question to see the kind of answer AiDA returns from your connected dealership data.

3 of 14 stores changed enough to investigate this week.

Downtown is the priority: cost per sale is up 31% while lead volume held flat. Two others slipped on show rate.

Sources: CRM · Google Ads · DMS

Two stores are tracking 12% and 18% behind month-to-date pace.

Both slowed at appointment-set rather than lead volume. Recovering last quarter’s rate closes most of the gap.

Sources: CRM · DMS · Sales targets

Leads are flat. The drop starts after the lead.

Appointment-set is down 18% and show rate down 21%. Sales follow the same curve with a two-week lag.

Sources: CRM · DMS · GA4

42 used units are past 60 days and absorbing 28% of VDP traffic.

They convert at less than half the group average. Three model lines account for most of the aging.

Sources: Inventory · GA4 · Marketplaces

Appointment-set at the three underperforming stores.

It is the single change with the largest modelled effect on units this month, ahead of any spend reallocation.

Sources: CRM · DMS · Google Ads · Meta Ads

Customer proof

Trusted by leading dealer groups.

Groups running dozens of rooftops use Autograph to cut the time between a question and a decision. Three of them on what changed for their teams.

Luxury black SUV on mountain road with Bannister Automotive Group logo, highlighting premium automotive services.
“As a fast-growing automotive group, we have data spread across different systems, stores and departments. Autograph helps us bring that information together, understand what’s driving performance and focus on what matters. It gives our teams a clearer picture of the business so we can make smarter, faster decisions across the group.”
Sean McMahonDirector, MarketingBannister Automotive Group
White electric SUV parked in front of modern building at night with Dilawri logo, showcasing Canada’s largest automotive group.
“Our partnership with Autograph has allowed us to streamline our data analysis processes and, as a result, freed up more time for valuable strategic marketing planning. It’s been a pleasure to work with Autograph's friendly, knowledgeable, and innovative team.”
Virginie AubertVP, Marketing & CommunicationsDilawri Group of Companies
Red sports car driving on highway at sunset with AutoCanada logo overlay, representing a top Canadian automotive group.
“We’ve worked with Autograph for many years, and their team has been incredibly helpful in understanding our data and how it flows across a complex dealership environment with multiple stores and brands. They bring a unique perspective to the data, help us understand what it’s really telling us, and have been a great partner. I’d highly recommend them.”
Andrew BrambillaSenior Director, MarketingAutoCanada

Know your next move.

See what AiDA can uncover in your dealership data.